Preweaning Piglet Mortality Hits Five-Year High

“You don't know what you don't know if you're not tracking it and if you're not monitoring it,” says Brad Eckberg, business analyst at MetaFarms, Inc.
That’s one of the reasons why the U.S. pork industry benchmarking effort started up years ago, when National Pork Board’s (then) Animal Science Committee recognized a need to have publicly available information for producers and other interested stakeholders.
“We saw how other countries, particularly Denmark and Australia, had publicly available data for their producers,” explains Chris Hostetler, director of animal science of the National Pork Board. “We wanted to provide that same opportunity for U.S. pork producers to gauge their progress against the top 10%, the average and the bottom 10% of the industry, so they could see where they fall and which areas they're doing well in and areas they need to focus more resources on.”
Hostetler says the major difference between the top 10% and the bottom 10% in almost every category is pretty revealing and can help researchers identify areas where work is needed.
“The top 10% gives us a gauge for what is attainable and the bottom 10% give us a gauge for the amount of progress that needs to be made,” Hostetler says.
A Look at the Data
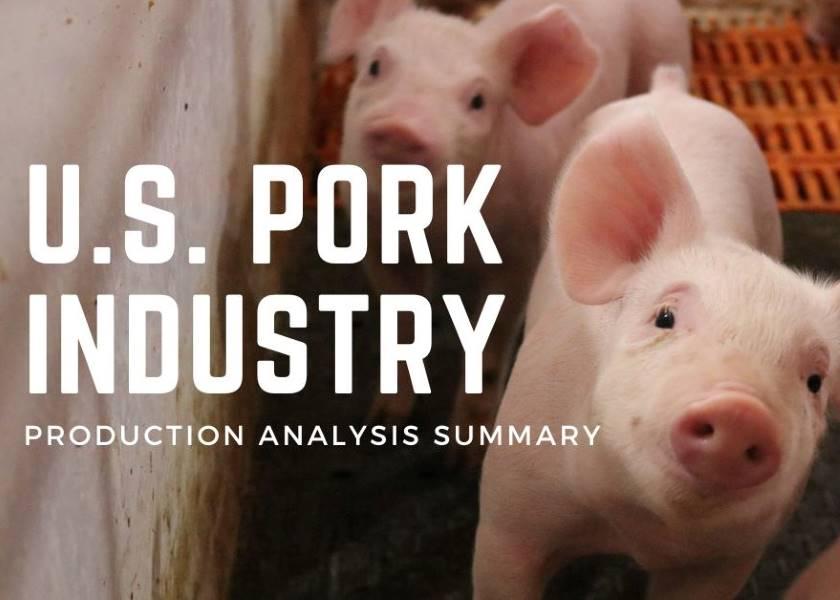
The result of the committee’s efforts is the Production Analysis Summary for the U.S. Pork Industry. The latest version represents data from the past five years (2017 to 2021).
The 2021 dataset represents 1,420,762 females from 543 farms as well as 18,809,292 nursery pigs, 19,358,798 finish pigs, and 10,617,512 single-stocked wean-to-finish pigs. The genetic makeup of the pigs in the study is representative of current U.S. genetics and reflects almost every genetics company on either the sow or boar side, Eckberg says.
Over 500 key performance indicators (KPI) were included in the data set, but the MetaFarms team minimized those metrics to be able to add value to the producer by taking a lot of the “noise” out of the data collection, he adds.
Here are some of the key takeaways.

• Average born alive (13.6) and pigs weaned per sow (11.40) numbers were both at five-year highs.
• There was a year-over-year increase in pigs weaned per mated female per year (25.74) which was partially offset by a five-year high in preweaning piglet mortality (14.4%).
• The preweaning mortality gap between the top 10% (8.3%) and bottom 10% (20.2%) of producers continues to be very wide.
• Sow mortality (12.6%) continues to be elevated compared to historical levels (11.1%, 2017).

• Days on feed was unchanged (44.7 days) but out-weight increased by 1.29 pounds from 2017 to 2021.

• From 2017 to 2021, days on feed decreased by 4.1 while out-weight increased by 4.77 pounds.
• Feed conversion has been maintained at 2.8 to 2.9 pounds of feed per pound of gain during the analysis.

• Feed conversion has been maintained at 2.57 to 2.61 pounds of feed per pound of gain from 2017 to 2021.
What Caught the Experts’ Eye
“On the sow side, we did a performance by pigs weaned per mated female per year. Isn’t that the gold standard of how we are doing as a sow farm?” Eckberg says.
It takes into effect how many pigs are produced per mated female per year which results in a farm’s main goal of producing weaned pigs.
“The target right now is above 30 pigs weaned per mated female per year,” he says. “If I'm at 26 pigs weaned per mated female per year, and I want to be at 28 or 30, data can help show me what I need to do to get to that point.”
One thing that sticks out to him as an area for improvement is repeat matings.
“Repeat matings hurt a farm,” Eckberg says. “It's just a fact they're less productive. Diving into it more from a mortality/animal husbandry perspective, you see lower prewean mortalities, lower death loss on farms that are producing better.”
Hostetler likes seeing the changes by year in graphical form. Looking at the top 10% versus the average versus the bottom 10% for certain KPIs is extremely helpful in distilling down some of the primary drivers from each of those phases.
When Should You “Freak Out?”
When reviewing production data and benchmarking analysis, when should you be truly concerned and when should you see something as merely a fluke in the data?
“To give a pure answer, statistically speaking, you need three data points to constitute a trend,” Hostetler says. “Two data points don’t constitute a trend. Degree of concern varies by KPI. Whether or not it's something that dramatically affects your bottom line is a factor. You may get excited about a trend after three data points if it is something that drives profitability. But if it's something that you know is not a driver of profitability for your enterprise, then you may not get excited about it until you see it pop up four or five times.”
For many producers, especially those that have less than 10,000 sows or market less than 250,000 pigs a year, Eckberg says they often don’t have the bandwidth to track or monitor the data as much.
“They are ‘in the weeds’ in day-to-day pork production and it’s tough to stop and say, ‘Well, let's look at the performance numbers,’” he says.
Looking at the data and monitoring it on a frequent basis is key, however. He says whether a farm uses a consultant or not, it’s important to set realistic goals with your veterinarian’s help as to what your expectations are depending on your herd health, geographic location and historical information.
“Being able to have that threshold alert for your data so you can say, ‘There's something's going on here,’ is important. Producers need to be able to say, ‘Here is where we're at, here is where we want to be as a goal for an improvement,’” Eckberg says.
A New Trend on the Horizon
Closeout data has historically been the data source for making management decisions for wean-to-finish and grow-to-finish enterprises, Hostetler says.
“For producers, that is always looking in the rearview mirror because closeout data is on a group of pigs that has already left the barn. They've already gone to market. That feed has already disappeared out of the feed bin. I think with the new technologies to be able to real-time monitor certain things and collect that data and look at it more frequently, it will really change that idea of what constitutes a trend and allow for more timely management decisions,” he says.
Being able to real-time monitor pig growth and feed utilization, water consumption, drug and antibiotic use will help our producers get better at smart farming and using technology on farms, Hostetler adds.
One of the limitations of the report is that it doesn’t include information on medication usage, he points out. It also is annualized data and does not include seasonal effects.
“From a MetaFarms perspective, when we talk about medication and sample size, making sure that it's accurate as it's actually put in by the customers, it's all over the board within the platform,” Eckberg says. “So, we felt like we could not stand behind that number. There are a couple of charts that do have some weights and seasonality and mortality for 2021. But for the most part, it is basically from a year analysis.”
Read Part 2: Mortality Continues to Plague Producers
Stay tuned for Part 3: Don’t Miss the Bright Spots in the U.S. Pork Industry Benchmarking Data
Read More:
Pork Industry Now Contributes $57 Billion to U.S. GDP


