Farmland Values Level Off As Farm Income Weakens
Farmland values continue on a steady trend throughout most of the country, according to the 2018 first-quarter reports from four Federal Reserve banks. Weakness remains for farmland values in the Great Plains, where values continue to drift slightly below year-ago levels. Yet, in the eastern Corn Belt and South, farmland values continue to mark year-over-year gains—especially in ranch or pastureland.
While farmland values have mostly stabilized, the financial standing for farmers remain weak. Due to lower prices and challenging weather conditions, farmers are facing their fifth year of lower farm income, liquidity and working capital. As a result, bankers are tightening their credit requirements.
Here’s a breakdown of land market moves from four Federal Reserve banks, highlighting the year-over-year changes.

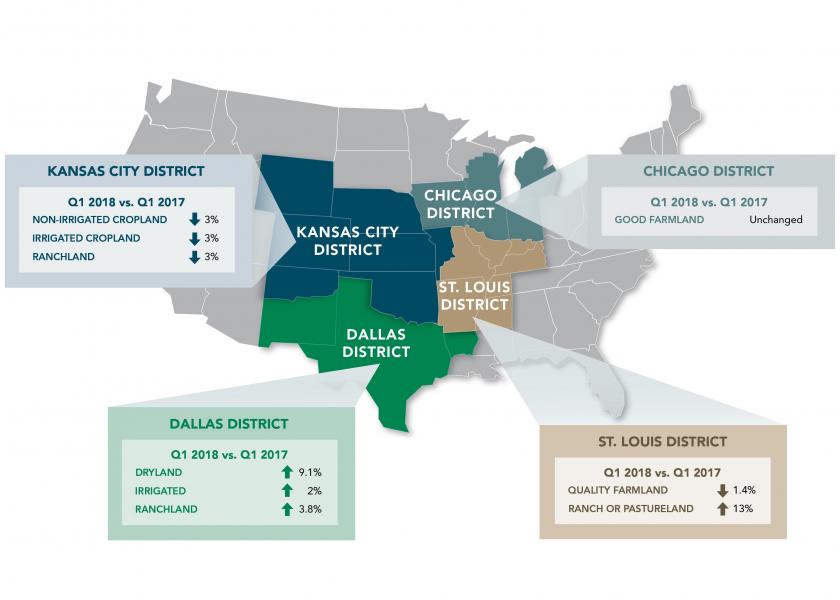
Kansas City District (Central/Southern Plains)
- Non-irrigated cropland: -3%
- Irrigated cropland: -3%
- Ranchland: -3%

Source: Kansas City Federal Reserve Bank
Bankers in the 10th district report the fifth straight year of lower farm income. Credit conditions for the area’s farmers continue to diminish, but at a slower pace than previous quarters, report Cortney Cowley, economist and Ty Kreitman, assistant economist.
“Cash-flow shortages continued to limit the availability of working capital, and financing needs continued to rise,” the economists say. “Bankers have responded to ongoing cash-flow concerns by restructuring debt, increasing or maintaining collateral requirements or—in some cases—denying loans.”
In the first quarter, 8% of farm loan requests were denied due to cash-flow shortages. Farmers’ working capital continues to deplete, while carryover debt levels have increased.
“We are seeing some customers selling assets, such as farmland, to cover debts.” —Nebraska lender
Dallas District (The South/Southwest)
- Dryland: 9.1%
- Irrigated: 2%
- Ranchland: 3.8%
Real Land Values

Source: Dallas Federal Reserve Bank
Values for all three land categories in the 11th District posted year-over-year increases, with dryland cropland values increasing the most. The average value of dryland cropland in the District is $1,928; the average value of irrigated cropland is $2,596; and the average value of ranchland is $1,757.
Bankers report persistently dry weather is bruising the area’s winter wheat crop, which limited cattle grazing opportunities and depleted hay inventories. This is causing some tough financial decisions for farmers in the region.
Demand for agricultural loans continued to decrease for a 10th consecutive quarter, while loan renewals and extensions accelerated for farmers. While the majority—84.5%—of bankers surveyed say credit standards for agricultural loans have remained stable over the past three months compared to a year earlier, 15.5% say they have tightened.
“Drought conditions continue to be the driving factor in planning and budgeting this year. If conditions persist, there will be fewer producers next years.” —Texas lender
Chicago District (Corn Belt)
- Good farmland: unchanged
Percent Change in Dollar Value of "Good" Farmland
(Top: Jan. 1, 2018 to April 1, 2018; Bottom: April 1, 2017 to April 1, 2018)

Source: Chicago Federal Reserve Bank
Farmland values continue to stabilize in the 7th District, marking the fifth straight quarter without a decline in values. The supply of farmland for sale rose a bit, but demand and sales slipped, rep-orts David Oppedahl, senior business economist for the region.
Cash rental rates decreased again in 2018, but the year-over-year decline of 5% was smaller than the drop seen in 2017. “Cash rental rates coming down have allowed the structure of costs to be a bit lower,” he says. “That’s helping keep the cash flows a little stronger, but it is still very tight in ag conditions.”
Cash rental rates didn’t fall much, because enough farmers were willing to add acres. Meanwhile, some farmers quietly ended rental contracts or even defaulted on payments to landowners.
“Land rental rates are status quo to slightly lower, but demand limits a reduction in rent per acre.” —Iowa lender
St. Louis District (Southern/Eastern Corn Belt)
- Quality farmland: -1.4%
- Ranch or pastureland: 13%

Source: St. Louis Federal Reserve Bank
Ranch and pastureland continue to outshine quality farmland in the 8th District. For the second quarter in a row, ranchland and pastureland has increased by more than 13%. Cash rents for this type of land also increased 12.6%, compared to last year.
Meanwhile, values and cash rents for quality farmland dropped slightly. This is the first decline in quality farmland values since the second quarter of 2017. Bankers expect the two classes of land to continue to move in diverging patterns—both in land values and cash rent prices.
Income for farmers in this area declined for the 17th consecutive quarter. But, slightly more bankers are optimistic about the prospects for farm income, household income and capital expenditures for the next three months. Currently, farm household spending and capital expenditures are below year-ago levels.
“Few farmers and their bankers are interested in acquiring land due to really tight cash flow coverage ratios.” —Missouri lender